It's All About The Data
Part of what I do for a living is move data from one place to another. In and out of databases; out to reports or exports to spreadsheets. Raw numbers serve daily business operations well.
For analysis, getting a feel for the 'big picture', or making it easier to explain a workflow, visualization is the way to go. This might be a graph, a map, or diagram. I get much enjoyment in being able to give data more meaning than just a grid of numbers on a spreadsheet. This web page shows examples of how I have used visualization in my professional projects.
Visualization Examples
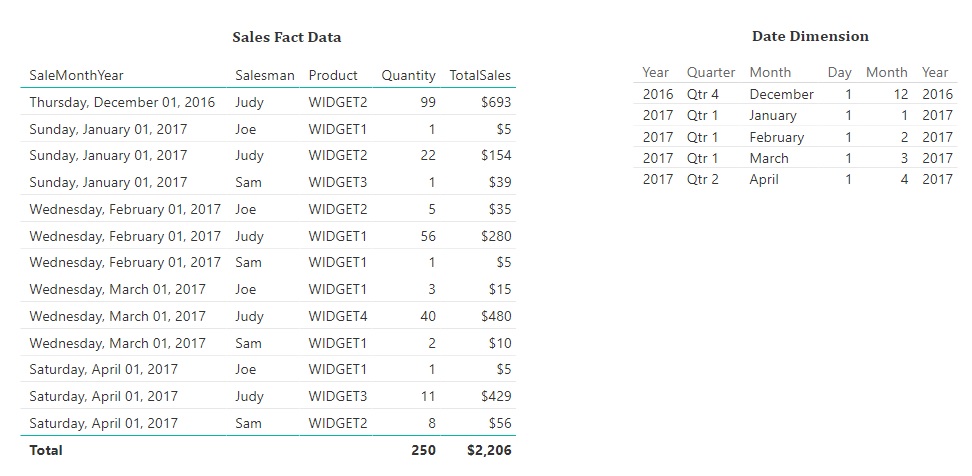
In preparation for a job interview, I downloaded the Power BI Desktop application and signed up for a free Microsoft Power BI account. I created a simple data source with 13 rows representing sales by salesperson by date. In one afternoon, I was able to publish the following interactive dashboard.
Click on icons above the "Quantity by Product" report to filter and drill-down into that graph. Click on any bar in any of the three bar graphs to filter the data in all other graphs (the interaction is configurable within the report). I added a date slider to filter data by date range. You can mark checkboxes under the Salesman, Product, Year columns to the right to filter data even further. The second tab of the report shows the raw data.
Overall, I find Power BI to be an intuitive and easy to use tool for visualization. It is even more powerful when you understand how to link to data sources, create data models and customize dashboards using the DAX programming language. I was able to do further data integration testing with Microsoft Azure by creating a free trial account. Just be cautious as to how Azure charges you for resource use. Even if you don't access your data in the cloud doesn't mean Microsoft won't be charging you for the convenience of storing on their servers!
Data
While creating statistical cross-tab reports from mainframe data using SAS, I discovered our company had a color printer in another building that I could print to over the network. After playing around with types and styles, I came up with this visualization. Upper management liked it so much that they had me schedule these to run on a monthly basis to use during industry presentations.
Click on an image to see it in a light box.

LTV graph, by month

Multiple pie charts

State map
A data model (logical or physical) shows the relationship between objects. Before you can write applications or reports, you have to decide what data to store and how to store it. Designing your database correctly at the start of a project is critical in preventing performance issues and development bottlenecks later on.
Click on an image to see it in a light box.
")
OLTP data model (Customer to Points)

BI cube maintenance
Data flow diagrams go a long way to show complexity and inter-connectivity. Here are a few I created during projects to show the impact of changes to a process and details of where a change needed to be made.
Click on an image to see it in a light box.

Data exchange between boats and shore

System interfaces to accounting system

SSIS Package for syncing databases
I was careful to remove and obfuscate some of the information so as not to reveal the client I was working for and exact purpose of the report.
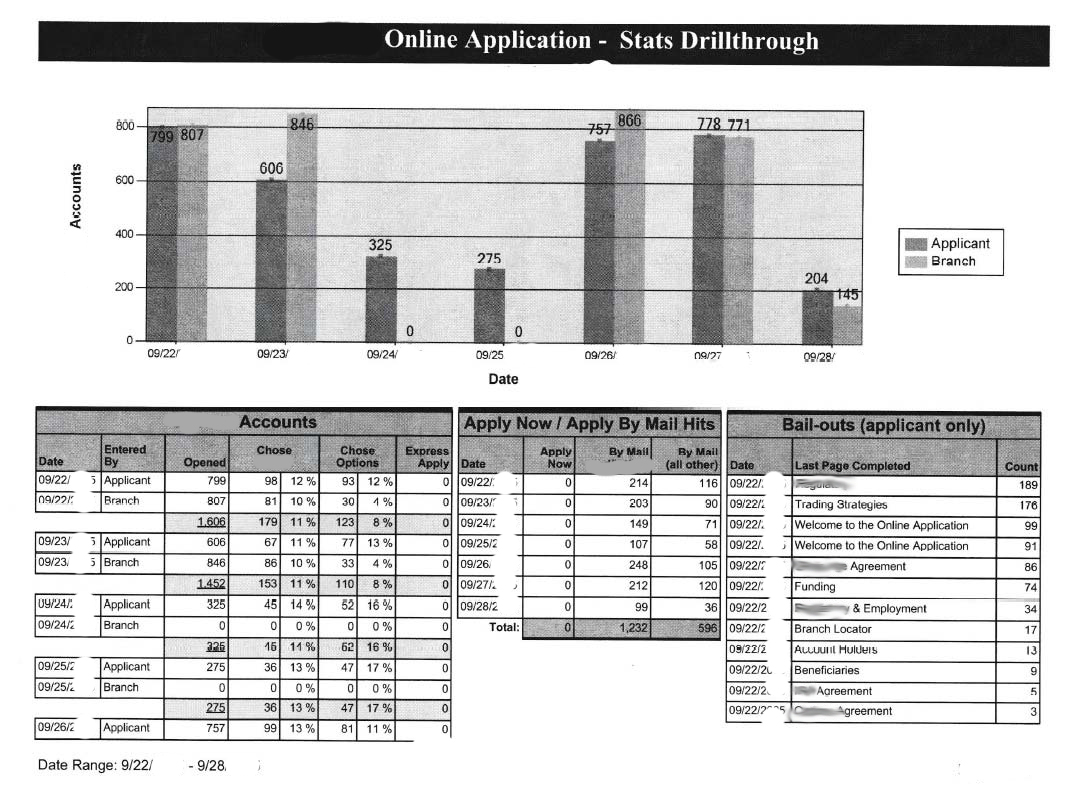
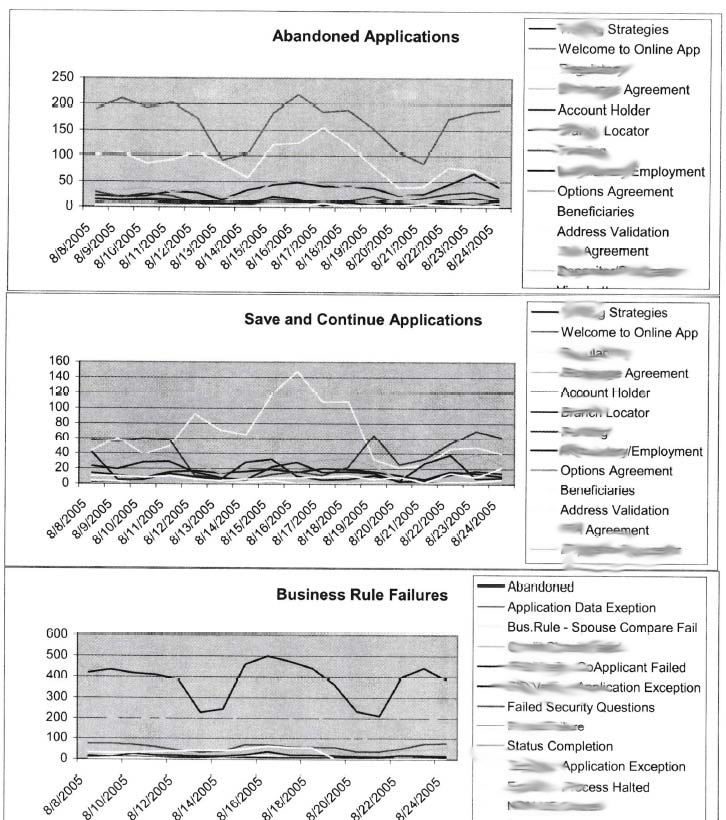
I wrote these to show counts and percentages of how customers used a web site, such as where they navigated to and where they may have bailed out. These were written in Microsoft Reporting Services and automatically scheduled to be delivered to management every business day.
Click on an image to see it in a light box.
One of the very first projects I ever worked on as a professional programmer was to create reports on an Okidata printer consisting of part measurement statistics. A worker would use a caliper to measure parts on the production line. That data would them be dumped into a desktop workstation where it was used in reports. The reports let the engineers know if the tool and die machines were getting out of specification and had to be adjusted. It is important to suppliers of parts to the automotive industry that all parts pass certain tolerance requirements.
Click on an image to see it in a light box.


I had a lot of fun mapping geographic data points for an employer. There were certain mile points of the U. S. waterway system that we did business on, but did not have data for them in our database to help us track asset location. When the USGS did not have official waypoints for miles, docks, or facilities on rivers for us to use, we created our own. Using Google earth and it's mapping tools, here are some visualizations of data related to rivers.
Click on an image to see it in a light box.

Facilities, Docks, Locks

Mobile River and Tennessee Tombigbee

Porposed Chickasaw Waypoints
